The Pacific slope rainy season in Costa Rica is from May to mid-December with a dramatic peak in precipitation September into November. There’s nearly no rainfall in the dry season between January and April. The Caribbean coast follows a different pattern with more consistent rainfall year round but noticeable decreases centered on October and March.
Rainfall is just one of the factors that goes into determining the best time to visit Costa Rica and by its very nature weather is unpredictable. The 20 years of data that went into the rainfall map and monthly charts below will give you a good idea what it’s like on average but do not provide any guarantees.
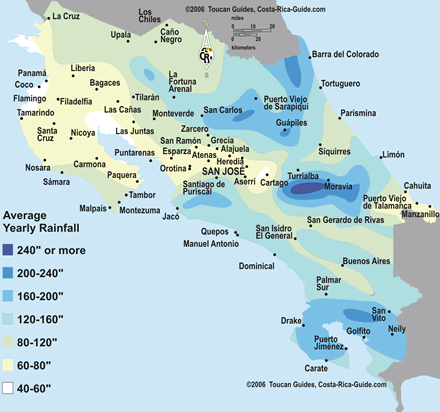
Average Yearly & Detailed Monthly Rainfall for Anywhere in Costa Rica
The contours on the map below show yearly rainfall totals giving an overview of the rainiest and driest average weather in Costa Rica. It’s apparent that the north is drier than the south and the west is drier than the east which is why the big multinational all inclusive resorts are all located in the northwest.
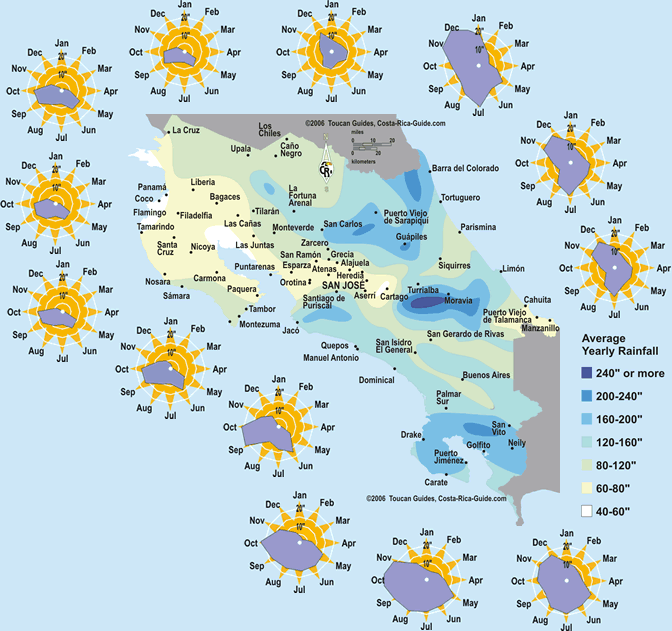
Each region is linked to a monthly rainfall chart which gives a detailed view of regional weather at different times of the year. The radial rain charts may be a bit confusing at first but they are very easy to read.
 |
|||
 |
|||
Mouse over the region of interest to display the monthly rainfall chart. Some cell phones are unable to display this information correctly so we’ve made an alternate static image summary.
The seasonal weather weather map of yearly and monthly sunshine and temperatures for each region compliments this one.