You may not have seen charts like this before, but they are very easy to read.
Monthly Rainfall by Region
The more of a month that is covered by the blue rainfall blob, the more it rains that month.
For example the red outlines highlight the month of August when it rains much less in Jacó (about 10″) than it does in Corcovado (over 20″). Both locations are relatively wet in August compared to December through April.

You can see at a glance that Corcovado has a longer wetter rainy season than Jacó. It’s also easy to see that the driest time to travel to Corcovado or Jacó is January through April when Jacó gets essentially no rain and Corcovado only 5″ to 8″ per month (which is still quite a bit).
The dip in rainfall at Jacó (Corcovado doesn’t have it) during July and August is called veranillo (little summer) and occurs each year when the inter-tropical convergence zone (ITCZ) moves north past Costa Rica giving a little dry season in the middle of the rainy season in some places.
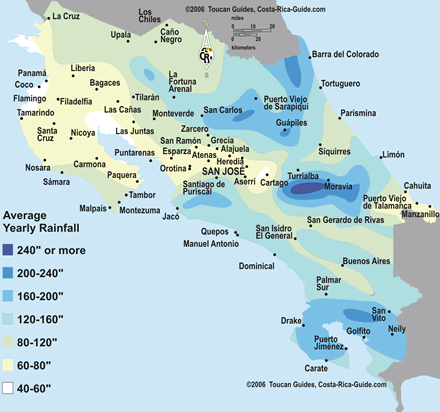
If you’re interested in the details you can read all about how Costa Rica’s rainy season occurs or click here for the rainfall mouseover Weather Map showing charts for all of Costa Rica
Average, High and Low Temperatures by Region
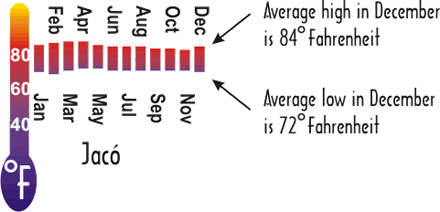
The temperature charts show the average high and low temperatures for each month at locations around Costa Rica.
In this example the average high in Jacó Beach in December is 84 degrees Fahrenheit and the low is 72. The highs creep up a bit by April and drop off in September, October and November when the cooling clouds and rain are most common but overall it’s very consistently in the low eighties on average throughout the year.

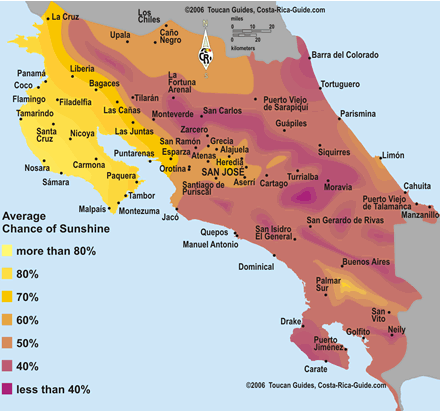
Click here for the sunshine and temperature mouseover weather Map showing charts for all of Costa Rica


