Costa Rica’s dry season is most dramatic in the northwest part of the country where almost no rain falls between January and April. The further south on the Pacific side occasional showers are possible any time and the real rains typically start earlier in May, fall harder through the rainy season and stick around longer into November or December. The east coast is wetter year round with less distinct seasonal precipitation but September and October are reliably sunnier and drier.
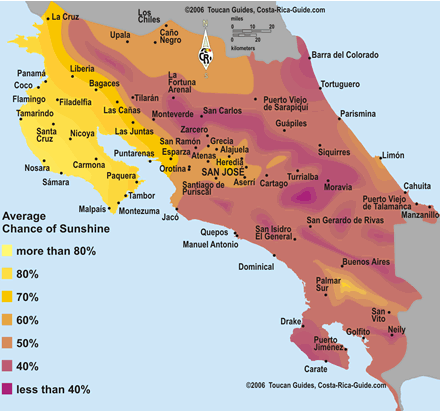
Costa Rica Temperature & Sunshine Map
Temperatures are consistently warm and tropical year round in Costa Rica averaging between 72 and 82 °F (22 and 28 °C). The northwest is hotter in the dry season February through May when there are no rains too cool things off. Temperatures across the country are a bit lower in November and December when rains are common and cool air from the north pushes down. Coastal water temperatures are warm all year as well so leave your wetsuit at home.
Temperatures drop about 10 degrees Fahrenheit (5.5 degrees Celsius) every 3,000 feet (1,000 meters) higher you climb on the slopes of the mountains and volcanoes that form the ridge down the center of the country. It can drop to freezing overnight at the highest elevations.
The contours on the map show the average chance that the sun will be shining any hour of any day across Costa Rica and if you mouse over a region the chart at the bottom shows the normal high and low temperatures for every month of the year in that region.
The high, low and average temperature charts are very easy to read.
 |
|||
 |
|||
Mouse over the region of interest to display the average monthly temperatures. Some cell phones are unable to display this information correctly so we’ve made an alternate static image summary.
The seasonal weather weather map of yearly and monthly rainfall for each region compliments this one and is also helpful when you’re trying to decide the best time to visit Costa Rica.
