Alert: The Naviera Tambor Ferry crashed into and damaged the dock at Paquera Tuesday April 9th 2024 and ferry service from Puntarenas to/from Paquera is cancelled until further notice. >> UPDATE APRIL 10, 2024 Tempisque Bridge Repairs Starting April 1, 2024 the Friendship Bridge (Puente la … [Read more...]
Travel
Practical travel information like transportation options, driving, safety, health, packing, lodging, holidays, festivals, money and much more. Includes a section on weather, seasons, crowds and pricing to help you decide the best time to visit
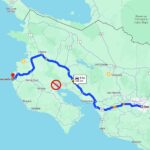
Costa Rica Small Boats – Panga, Lancha, Ferry & Raft

Shortcuts - boating across may be much faster than driving around a body of water in Costa Rica. For example the boat ride across the Gulf of Nicoya from Jacó on the mainland to Montezuma on the peninsula (see orange line below) takes about an hour while driving around takes over four hours. ██ … [Read more...]
Do I Need Four Wheel Drive in Costa Rica?

The answer to the question "is 4WD necessary in Costa Rica?" is nearly always no. Since renting an SUV can be twice as expensive as choosing a standard car it's worth considering whether the extra capability is needed. Paved access to the most popular destinations means the majority of travelers … [Read more...]
La Nada, La Niña & El Niño in Costa Rica
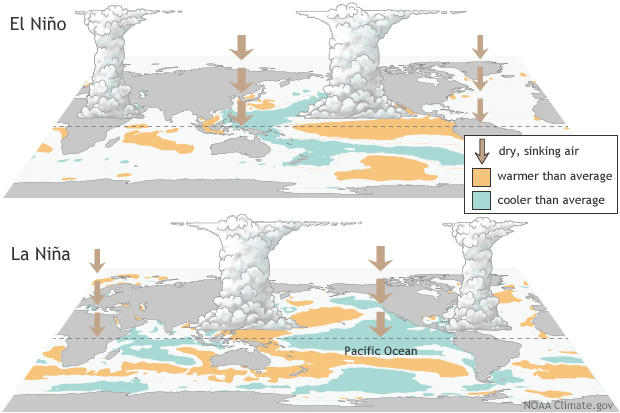
NOTE: the 2023/24 El Niño ended in mid-April and there's a 85% chance that La Niña will develop by August. Details from U.S. NOAA Warm water in the Pacific Ocean influences weather patterns around the world in a phenomenon called El Niño while cool water and the associated weather patterns are … [Read more...]
Private (Pirate) & Turo Car Rentals
As the average price of a rental SUV has pushed past $100 per day there has been an explosion in "private rentals". Individuals who have an extra vehicle or don't need theirs for a few days see the opportunity for huge profits. An average salary is less than $1,000 a month in Costa Rica and making … [Read more...]
Costa Rica’s Domestic Airlines

luggage restrictions | ticketing | airports | flights worth taking | charters | recommended Prices have definitely increased on average since the lengthy competition between Sansa and Nature Air ended. You can still find flights worth taking in Costa Rica but it may take more looking. Puddle … [Read more...]
The Best Time to Visit Costa Rica
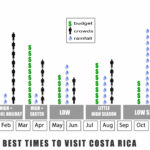
When Should You Go to Costa Rica? The most popular time for Costa Rica vacations is the holiday peak season around Christmas and New Years but the best time to visit may be a couple of weeks later after the crowds thin. The rains end in December but the forests remain lush into the new year … [Read more...]
No Driving at Night in Costa Rica

"The Arenal volcano tour ends with a sunset mirador at 5:30 p.m. so we'll just pack and drive up to Monteverde for dinner then..." -- More like breakfast if you're lucky. Although a few km of modern highway are added to Costa Rica's road system each year driving at night on most routes is not … [Read more...]
Charter Flights

Private Planes & Helicopters in Costa Rica A thirty minute flight may save six or eight hours compared to ground transportation. save time & money | scheduled flights | charter companies | air destinations | flying Chartering a plane might sound like something only the rich and … [Read more...]
January in Costa Rica
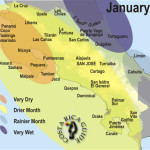
The last three weeks of January is one of the best times for a Costa Rica vacation. New Years is also great from the perspective of weather but it's crowded and peak season surcharges make it one of the most expensive weeks of the year. All the best tours and activities are going full blast … [Read more...]
February in Costa Rica
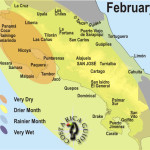
February might just be the best time there is for a Costa Rica vacation. The weather is hot and dry in the most beach popular destinations and it's when we discovered many of our "Best Trips Ever." Best Time to Travel? Select … [Read more...]
March in Costa Rica
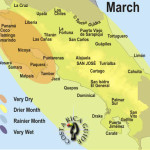
Early March is definitely a good time for a Costa Rica vacation (see our favorite routes). The most popular destinations have hot dry weather and many hotels and lodges have some rooms available even a couple of weeks ahead. Later in March Spring Break travel may reduce availability and raise … [Read more...]
April in Costa Rica
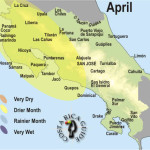
Select Month January February March April May June July August September October November December or see when to travel? Our favorite time to travel is when it's cold up north and many of our "Best Trips Ever" were in the first part of the year. The tropical beaches are a sure cure … [Read more...]
May in Costa Rica
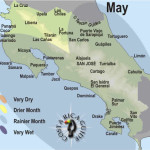
Select Month January February March April May June July August September October November December or see when to go summary May can be fantastic. The low season is kicking in, there are no crowds, prices are down and although the rains start in May it's usually nothing like the … [Read more...]
June in Cost Rica – Best Time to Travel?
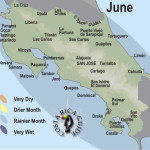
Select Month January February March April May June July August September October November December or see when should we go? If you want to get a head start on summer June is a great time to visit Costa Rica. Popular destinations have shed their crowds and you can enjoy some of the … [Read more...]
July in Costa Rica
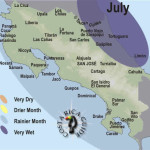
Best Time to Travel - Low Season? Select Month January February March April May June July August September October November December or see when to travel in Costa Rica Twenty years ago only insiders traveled to Costa Rica in July, but the secret is out so we've started … [Read more...]
August in Costa Rica – The Best Time to Go
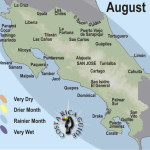
Select Month January February March April May June July August September October November December or see best times to visit August is probably our personal favorite month for traveling around Costa Rica. It's "winter" on the Tico calendar but a tropical beach fits perfectly into … [Read more...]
September in Costa Rica – Best on the Caribbean
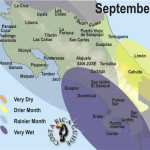
Select Month January February March April May June July August September October November December or see when to go summary You have to be a little choosy to find the best things to do in September and unless you know where to look the wildlife might be hidden away trying to escape … [Read more...]
October in Costa Rica – Best Time for the Caribbean
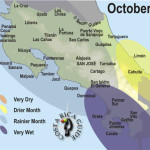
Select Month January February March April May June July August September October November December or see best time to visit Costa Rica The typical rainfall patterns are inverted this month some of the top itineraries to the Pacific resort areas get washed out. It's the perfect time … [Read more...]
November in Costa Rica – Could be Great
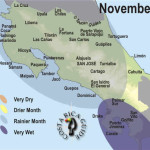
A good friend of ours is a Costa Rica wedding planner and when she scheduled her own beach ceremony for November we thought she was nuts. Every bride wants everything perfect and she must have led a charmed life indeed because it turned out perfectly despite the fact that it's one of the most … [Read more...]